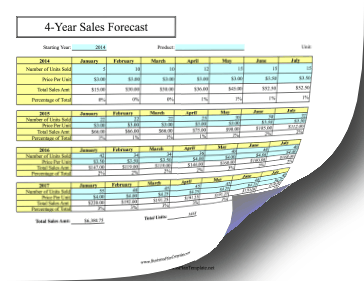
Predict how many units of a product will be sold over the course of four years in monthly increments. Users fill in the blue boxes.

Sample text from 48-Month Sales Forecast:
4-Year Sales Forecast
| Starting Year | Product | Unit | |||||||||||
| January | February | March | April | May | June | July | August | September | October | November | December | Total | |
|---|---|---|---|---|---|---|---|---|---|---|---|---|---|
| Number of Units Sold |
|||||||||||||
| Price Per Unit |
|||||||||||||
| Total Sales Amt |
|||||||||||||
| Percentage of Total |
| Total Sales Amt | Total Units | ||||||||||||