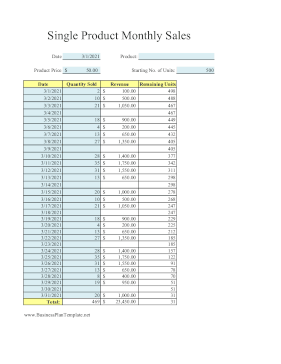
Great for evaluating the worth of a product, this printable monthly sales reports tracks quantity sold and revenue generated. User fills in the blue cells; white cells fill automatically.

Sample text from Single Product Monthly Sales Report:
| Starting Date: | 3/1/2021 | Product: | Product Name | |
| Product Price: | $2.50 | Starting No. of Units: | 2000 |
| Date | Quantity Sold | Revenue | Remaining Units |
| 3/1/2021 | |||
| 3/2/2021 | |||
| 3/3/2021 | |||
| 3/4/2021 | |||
| 3/5/2021 | |||
| 3/6/2021 | |||
| 3/7/2021 | |||
| 3/8/2021 | |||
| 3/9/2021 | |||
| 3/10/2021 | |||
| 3/11/2021 | |||
| 3/12/2021 | |||
| 3/13/2021 | |||
| 3/14/2021 | |||
| 3/15/2021 | |||
| 3/16/2021 | |||
| 3/17/2021 | |||
| 3/18/2021 | |||
| 3/19/2021 | |||
| 3/20/2021 | |||
| 3/21/2021 | |||
| 3/22/2021 | |||
| 3/23/2021 | |||
| 3/24/2021 | |||
| 3/25/2021 | |||
| 3/26/2021 | |||
| 3/27/2021 | |||
| 3/28/2021 | |||
| 3/29/2021 | |||
| 3/30/2021 | |||
| 3/31/2021 | |||
| Total: |